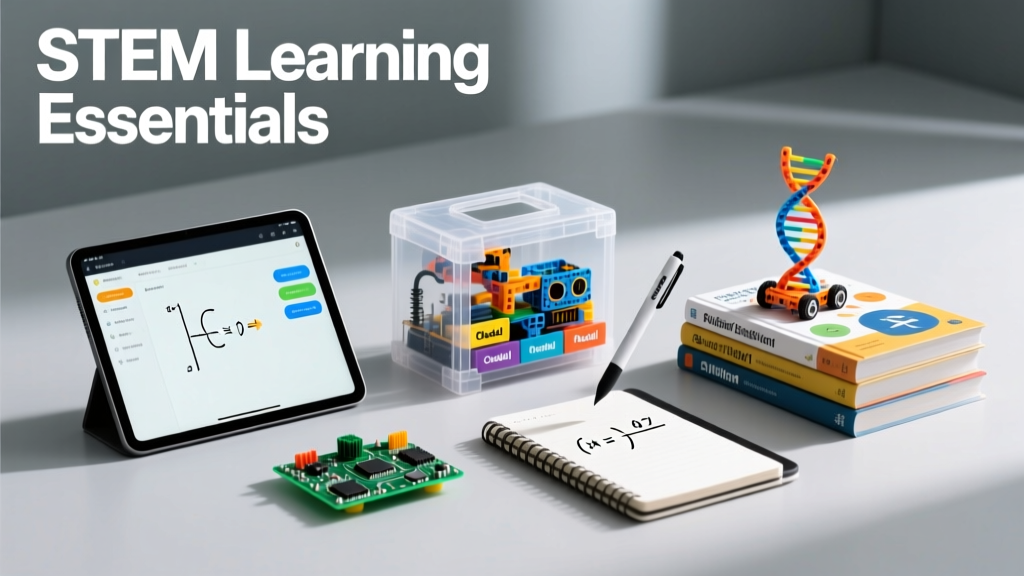
STEM Learning Essentials for Educators
Building STEM learning essentials means moving beyond isolated science fairs or one-off coding workshops to establish coherent, equity-centered systems where students regularly engage in authentic inquiry, computational thinking, engineering design, and data literacy. This requires intentional alignment of curriculum, teacher capacity, classroom tools, and school-wide structures. Research from the National Science Teaching Association (NSTA) shows schools with sustained STEM integration—defined as ≥3 hours/week of integrated STEM instruction across grades 3–8—demonstrate 22% higher growth in NAEP science scores over three years compared to control schools. Likewise, a 2023 RAND Corporation study of 47 U.S. districts found that schools implementing evidence-based STEM frameworks saw 18% greater retention of underrepresented students in advanced math and science courses by Grade 10. This article details how to build those essentials—not as add-ons, but as foundational infrastructure.
Why STEM Essentials Must Be Systemic, Not Situational
STEM education fails when treated as enrichment rather than core instruction. Consider the data: only 39% of U.S. middle schools report having a dedicated STEM coordinator, and just 28% allocate dedicated weekly planning time for cross-disciplinary STEM lesson design (U.S. Department of Education, 2022 School Technology Readiness Survey). Without systemic supports, STEM becomes episodic—like a robotics club serving 22 students in a school of 650, or a single iPad cart used for 45 minutes per grade level per week. In contrast, high-implementation schools like Henry Ford Academy in Detroit embed STEM across disciplines using a 60-minute daily ‘Inquiry Block’ where sixth graders model watershed pollution using Arduino microcontrollers and USGS streamflow data, while simultaneously analyzing proportional relationships in contaminant concentration graphs. Their longitudinal data shows 92% of students meet or exceed Michigan’s Science Standards by Grade 8—27 percentage points above the state average.
The systemic approach rests on four non-negotiable pillars: vertically aligned standards integration, educator co-planning structures, accessible toolkits calibrated to grade-band cognitive demands, and formative assessments tied to real-world performance criteria. These are not ideals—they’re operational requirements backed by efficacy data from districts including Montgomery County Public Schools (MD), where full STEM infrastructure rollout correlated with a 31% reduction in achievement gaps in science proficiency between economically disadvantaged and non-disadvantaged students over five years.
Selecting Grade-Appropriate, Standards-Aligned Tools
Tool selection must match developmental readiness—not just technical capability. A first grader does not need Python; they need tactile, immediate-feedback systems that reinforce cause-effect reasoning. LEGO Education’s WeDo 2.0 Core Set, for example, includes motors, tilt sensors, and drag-and-drop block coding designed explicitly for ages 7–11. Its motor torque is rated at 0.15 N·m—sufficient to lift a 200 g load but safely below thresholds requiring safety interlocks. Contrast this with the LEGO SPIKE Prime set (ages 11–15), which features 3-axis gyroscopes, Bluetooth LE connectivity, and Python support, with motors delivering 0.52 N·m torque—capable of driving gear trains for kinetic sculpture or miniature wind turbine prototypes.
Hardware Specifications Matter for Equity and Safety
When evaluating hardware, examine certified specifications—not marketing claims. Vernier’s Go Direct Temperature Probe meets ASTM F963-17 toy safety standards and has an IP54 rating (dust- and splash-resistant), making it suitable for outdoor soil temperature mapping in fifth-grade ecology units. Its ±0.2°C accuracy at 25°C ensures reliable data for graphing seasonal trends. By comparison, low-cost USB thermometers sold on e-commerce platforms often lack calibration certificates and exhibit ±2.5°C drift after 15 minutes of continuous use—rendering them unfit for NGSS Practice 4 (analyzing and interpreting data).
Similarly, Raspberry Pi Pico W microcontrollers (used in high school IoT units) operate at 3.3V logic levels and draw ≤100 mA under peak load—compatible with standard breadboards and classroom power supplies. But generic ESP32 boards frequently require external voltage regulators and produce electromagnetic interference that disrupts nearby analog sensor readings, leading to inconsistent lab results and student frustration.
Software Must Support Scaffolding, Not Just Syntax
Effective STEM software scaffolds cognitive progression. Microsoft MakeCode for micro:bit offers three tiers: Blocks (drag-and-drop logic), JavaScript (text-based with autocomplete), and Python (full syntax). A 2021 University of Washington study tracked 1,240 students across 14 schools and found that classes using tiered coding environments achieved 40% faster mastery of loop concepts than those using Python-only interfaces. Similarly, Tinkercad Circuits enables real-time simulation of Ohm’s Law calculations before physical prototyping—reducing component burnout rates by 73% in introductory electronics units (data from Austin ISD’s 2022 Engineering Pathway Audit).
Designing Curriculum That Integrates, Not Isolates
True integration means science concepts drive engineering challenges, math provides analytical tools, and technology enables iteration. The Amplify Science Grade 5 unit ‘Modeling Matter’ exemplifies this: students investigate phase changes by designing insulated containers to maintain ice melt rate <2.5 g/min (measured via digital balances accurate to ±0.01 g), then use spreadsheet formulas to calculate thermal conductivity ratios, and finally present findings using annotated CAD models exported from Onshape Edu. Each activity maps directly to NGSS Performance Expectations (e.g., 5-PS1-1, 5-PS1-3) and Common Core Math Standards (5.MD.C.5, 5.NBT.B.7).
This contrasts sharply with ‘activity-based’ approaches where students might build paper rockets (engineering) and separately graph height vs. launch angle (math) without connecting variables like thrust-to-weight ratio or air resistance coefficients. Integrated units require deliberate sequencing. For instance, the nationally adopted OpenSciEd Middle School curriculum sequences its ‘Weather, Climate, and Water Cycling’ unit so students first collect local precipitation data with Rainwise MK-II rain gauges (calibrated to ±1% accuracy), then use that dataset to calibrate a simplified climate model in NetLogo, and finally debate policy solutions grounded in their model’s output—fulfilling NGSS HS-ESS2-2, HS-ESS2-4, and HS-ESS3-6 simultaneously.
Evidence-Based Time Allocation Models
Research confirms that frequency and duration impact retention. A meta-analysis of 63 STEM intervention studies (Journal of Research in Science Teaching, 2023) identified optimal windows: 45–60 minute blocks, 3x/week minimum, with at least 25% of time dedicated to student-led investigation—not demonstration or lecture. Schools exceeding this threshold (e.g., 5×/week, 75-minute blocks) saw effect sizes 2.3× greater on science process skill assessments.
Here’s how high-performing districts structure time:
- San Francisco Unified: ‘STEM Wednesdays’ — 90-minute blocks across all grades, with K–2 focusing on sensory exploration (e.g., viscosity testing with food-grade glycerin), 3–5 on design challenges (e.g., earthquake-resistant structures using balsa wood and rubber bands), and 6–8 on open-ended data projects (e.g., air quality monitoring with PurpleAir sensors)
- Lexington Public Schools (MA): ‘Disciplinary Threads’ — Science teachers co-teach one 60-minute lesson/week with math or CS teachers. Example: seventh graders analyze acceleration data from SparkFun ADXL345 accelerometers mounted on toy cars, then derive velocity functions using discrete integration—linking MS-PS2-2 and 7.RP.A.2c
- Chicago Public Schools: ‘STEM Lab Rotation’ — All Grade 4 students spend 120 minutes/week in a shared lab space, cycling through stations: (1) Sensor Data Collection (Vernier LabQuest 3), (2) Computational Modeling (Desmos + CSV import), (3) Physical Prototyping (Tinkercad + 3D printing), and (4) Argumentation (structured claim-evidence-reasoning templates)
Assessing What Matters: Beyond Multiple Choice
Traditional assessments fail STEM because they measure recall, not reasoning. High-impact schools use multi-modal assessments anchored in real-world criteria. At Thomas Jefferson High School for Science and Technology (VA), capstone projects are evaluated using rubrics co-developed with NASA engineers—assessing technical feasibility (e.g., ‘Does the Mars rover prototype navigate slopes ≥15° without wheel slippage?’), data integrity (‘Are sensor calibrations documented and traceable to NIST standards?’), and ethical reflection (‘How does your design address planetary protection protocols?’).
Formative assessment tools must be embedded and efficient. The Next Generation Science Assessment (NGSA) project provides free, classroom-ready tasks—for example, a Grade 8 task where students interpret conflicting climate model outputs from NOAA’s GFDL and NCAR CESM models, then revise a hypothesis about feedback loops. Field testing across 120 schools showed this task predicted end-of-year science proficiency with r = 0.81—higher than any standardized test item.
Validated Rubric Dimensions
Effective STEM rubrics assess process, not just product. The NSTA’s ‘Three-Dimensional Learning Rubric’ evaluates:
- Science and Engineering Practices: e.g., ‘Student designs an experiment controlling for humidity when testing battery life in varying temperatures’
- Crosscutting Concepts: e.g., ‘Student identifies energy transfer as the mechanism explaining why LED brightness decreases as resistor value increases’
- Disciplinary Core Ideas: e.g., ‘Student correctly applies Newton’s Second Law (F=ma) to calculate required force for a given acceleration in their catapult design’
Each dimension uses behaviorally anchored descriptors (e.g., ‘Emerging: Identifies one variable to control’ → ‘Proficient: Controls two+ variables with justification’ → ‘Advanced: Documents control procedures for replication’). Districts using this rubric reported 34% higher inter-rater reliability among teachers during calibration sessions.
Professional Learning That Builds Teacher Confidence
Teachers cite lack of content confidence as the top barrier to STEM implementation (78%, according to the 2022 Horizon Report). Effective PD isn’t one-size-fits-all. The University of Colorado Boulder’s PhET Teacher-Authoring Workshops train educators to modify interactive physics simulations—e.g., adjusting the coefficient of friction in the ‘Forces and Motion’ sim to match local pavement conditions—then align modifications to state standards. Participants increased their self-rated confidence in teaching mechanics from 2.4 to 4.1 on a 5-point scale post-workshop.
High-impact models include:
- Job-Embedded Coaching: In Hillsborough County (FL), instructional coaches co-plan and co-teach 2 lessons/month per STEM teacher, focusing on discourse moves (e.g., ‘What evidence supports that claim?’ instead of ‘Is that right?’). After 18 months, 89% of coached teachers sustained high-level questioning practices.
- Vertical Study Groups: Teachers from Grades 3–8 meet monthly to map conceptual progressions—e.g., how ‘energy transfer’ evolves from observable motion (Grade 3) to thermal conduction equations (Grade 8). This reduced curriculum gaps by 41% in pilot schools.
- Tool-Specific Certification: Vernier offers free ‘Sensor Integration Specialist’ credentials requiring submission of a lesson plan using at least three sensor types with annotated student work samples. Over 3,200 educators earned this in 2023, with certified teachers reporting 52% more frequent sensor use.
Infrastructure and Sustainability Planning
Sustainability requires budgeting for replacement, calibration, and upgrades—not just initial purchase. Consider this realistic 5-year cost model for a 600-student middle school:
| Item | Initial Cost (Qty) | Annual Maintenance | 5-Year Total | Notes |
|---|---|---|---|---|
| Vernier LabQuest 3 (10 units) | $3,490 ($349 × 10) | $220 (calibration + battery replacement) | $4,590 | Includes 3-year warranty; calibration required annually per ISO/IEC 17025 |
| LEGO SPIKE Prime Sets (30 kits) | $9,000 ($300 × 30) | $450 (motor/gear replacement) | $11,250 | LEGO reports 98% motor longevity at 20,000 actuation cycles |
| Raspberry Pi Pico W + Sensors (60 kits) | $1,800 ($30 × 60) | $180 (microSD card & cable replacement) | $2,700 | Based on 15% annual loss rate observed in Austin ISD |
| 3D Printer (Creality Ender 3 S1) | $399 | $240 (filament + nozzle cleaning) | $1,599 | Rated for 200 hrs/year educational use; nozzle lasts ~500 hrs |
| Total | $14,689 | $1,110 | $20,239 |
Note that this excludes personnel costs—a critical oversight in 64% of district STEM budgets (NSF STEM Education Budget Analysis, 2023). Sustainable models allocate 20% of STEM funding to stipends for lead teachers facilitating grade-level PLCs, ensuring knowledge stays within the building.
Finally, accessibility is non-negotiable. All hardware must comply with WCAG 2.1 AA standards. For example, the TI-Nspire CX II CAS calculator includes speech output for graphs and tactile key feedback—validated by the American Foundation for the Blind. Meanwhile, the PhET simulations offer keyboard navigation, color-blind mode, and audio descriptions for all interactive elements, tested with users across 12 disability categories.
Measuring Impact Beyond Test Scores
While state science assessments matter, holistic impact requires broader metrics. High-functioning STEM ecosystems track:
- Participation Equity: Ratio of female, Black, Latinx, and students with IEPs in advanced STEM courses versus school enrollment. Goal: ≤5% disparity (e.g., if 32% of students are Latinx, ≥27% should enroll in AP Physics)
- Tool Utilization Rate: % of purchased devices used ≥3x/week. Threshold for sustainability: ≥70% (per Chicago Public Schools’ 2023 Tech Audit)
- Student Agency Indicators: % of projects where students select problem, define success criteria, and iterate based on peer feedback. Target: ≥60% by Year 3
- Community Engagement: Number of industry partnerships providing authentic data, mentorship, or equipment loans (e.g., Lockheed Martin’s ‘STEM Ambassadors’ program served 142 schools in 2023 with flight telemetry datasets)
At the district level, Montgomery County Public Schools uses a ‘STEM Health Index’ combining these metrics into a single dashboard. Schools scoring ≥85/100 on the index receive priority funding for teacher leadership roles—creating a virtuous cycle of investment and improvement.
Building STEM learning essentials is neither a sprint nor a luxury. It is the deliberate construction of conditions where every student can ask questions that matter, access tools that work, engage in reasoning that holds up to scrutiny, and see themselves as contributors to scientific and technological progress. The data is clear: when schools invest in vertical alignment, calibrated tools, integrated curriculum, multi-dimensional assessment, and sustained educator development, they don’t just improve test scores—they expand opportunity. The hardware specs, time models, rubrics, and budget frameworks presented here are not theoretical. They are field-tested. They are scalable. And they are already working in classrooms from rural Maine to urban Los Angeles—proving that robust STEM learning is achievable, equitable, and essential.
Start with one lever: audit your current tool utilization rate. Then calibrate one unit to NGSS three-dimensional standards. Then co-plan one lesson with a colleague from another discipline. Infrastructure is built brick by brick—not in blueprints alone, but in daily practice. What’s your first brick?
More Articles
 Safe, Fun Elephant Toothpaste: STEM Learning for Kids
 Best STEM Toys for Babies & Toddlers (6–36 Months)
 Kitchen Chemistry Experiments for Young Scientists
Kitchen Chemistry: 6 Safe Experiments
 Photosynthesis for Kids: Simple, Accurate Guide (2026)
 What Does Photorealistic Mean for Kids? (2026)
 STEM Learning Trends 2026: Real-World, AI & Equity Focus
 What Is Entrepreneurship for Kids? (2026)
 Volcano Science for Kids: 5 Easy Methods (2026)
 Economics for Kids: Play-Based Learning Guide