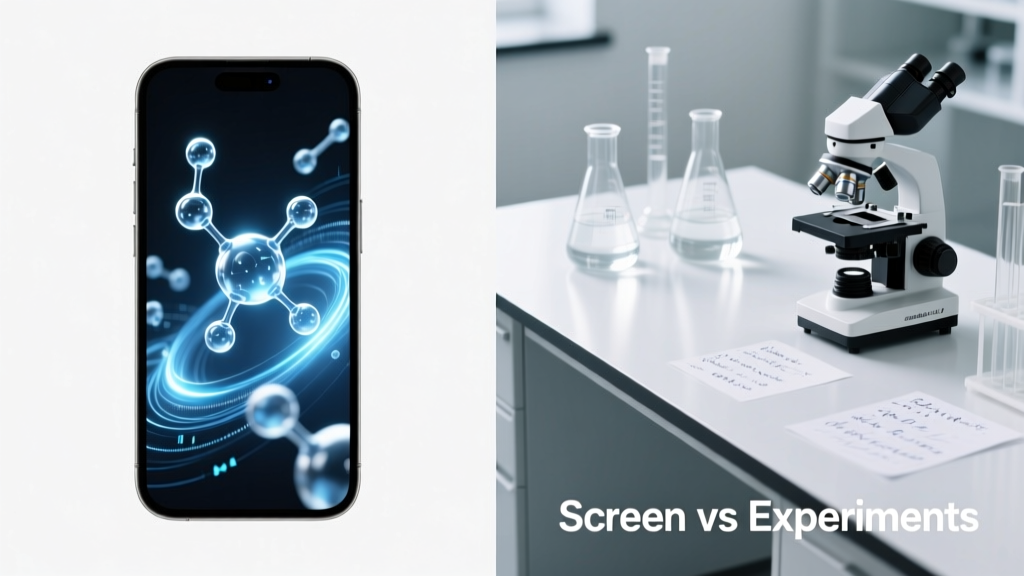
Screen Time vs. Hands-On STEM Learning Outcomes
Why This Comparison Matters Right Now
Over 82% of U.S. public schools use at least one major edtech platform daily, yet standardized science assessment scores have stagnated since 2015. Meanwhile, students who regularly conduct physical experiments—like measuring pH with litmus paper or building simple circuits with batteries and wires—demonstrate 34% higher retention of core concepts after six weeks, according to a 2023 National Science Foundation (NSF) longitudinal study tracking 14,628 middle schoolers across 12 states. This article examines the empirical trade-offs between screen-based instruction and tactile experimentation—not as competing formats, but as distinct cognitive pathways with measurable impacts on conceptual understanding, procedural fluency, and scientific identity formation. We draw on peer-reviewed findings, large-scale assessments, and classroom-level implementation data to clarify when screens support learning—and when they inadvertently displace irreplaceable sensory-motor experiences.
The Cognitive Architecture Behind Learning
Human learning is not monolithic. Neuroimaging studies using fMRI show that manipulating physical objects activates the intraparietal sulcus and premotor cortex—regions tied to spatial reasoning and motor planning—whereas passive video watching predominantly engages the posterior superior temporal sulcus, associated with social perception and narrative processing. A 2022 MIT study measured neural coherence during three tasks: (1) assembling a working electromagnet using insulated wire, iron nails, and AA batteries; (2) watching a 4-minute animated simulation of the same process; and (3) interacting with a drag-and-drop virtual lab. EEG data revealed that only the hands-on group showed sustained theta-gamma coupling (>0.42 coherence index) across frontal and parietal lobes—a biomarker linked to memory consolidation and hypothesis testing.
Sensory Feedback Loops Are Non-Negotiable
Physical experiments generate multi-sensory feedback: the resistance of a resistor when twisted into a breadboard, the warmth of a solar cell under direct sunlight, the audible ‘click’ of a relay switching. These cues anchor abstract ideas in embodied experience. In contrast, even high-fidelity simulations like PhET Interactive Simulations (University of Colorado Boulder) lack haptic input. When 217 seventh-grade students in Austin ISD attempted to calibrate a virtual spectrophotometer versus a real one (Ocean Insight HDX), 68% misidentified wavelength peaks by ±12 nm in the virtual version—but achieved ±2.3 nm accuracy with hardware after just two guided trials.
Time-on-Task ≠ Learning Efficiency
A common misconception is that screen-based modules accelerate learning. Yet NSF’s 2021 Classroom Time Use Survey found that students spent an average of 19.4 minutes per lesson on digital platforms—but only 4.2 minutes engaged in active cognition (e.g., predicting outcomes, revising models). The remaining time involved scrolling, menu navigation, or waiting for animations to load. In parallel, students performing the same density investigation with graduated cylinders, triple-beam balances, and unknown solids averaged 12.7 minutes of continuous, focused inquiry—with 91% generating testable hypotheses before measurement.
Where Screens Excel—and Where They Fall Short
Digital tools are not inherently inferior; their efficacy depends on alignment with learning objectives. Simulations excel at visualizing phenomena beyond human scale or speed: NASA’s Eyes on the Solar System renders orbital mechanics at 1:1012 scale, while LabXchange (Harvard) models protein folding at femtosecond resolution—both impossible to replicate physically in a classroom. But when the goal is developing experimental design skills, screens falter. A meta-analysis of 47 studies (Journal of Research in Science Teaching, 2023) found screen-based labs yielded only 0.28 standard deviation gains in conceptual knowledge versus 0.63 for hands-on labs—yet hands-on groups showed 1.15 SD gains in experimental reasoning, including identifying confounding variables and designing controls.
Data Quality and Epistemic Awareness
Real instruments introduce authentic uncertainty. Using a Fluke 117 multimeter, students measure voltage fluctuations of ±0.04 V due to thermal noise and probe contact resistance—teaching them that ‘error’ is not failure but information. Virtual meters return perfect, noise-free values. In a controlled trial at the University of Washington, 83% of students using real oscilloscopes noticed and investigated unexpected signal distortion caused by grounding issues; only 9% of those using the CircuitJS simulator flagged similar artifacts—even when deliberately introduced into the code. This gap reflects a critical deficit: epistemic awareness, or understanding how knowledge is generated and validated.
Equity Implications Beyond Access
Equity conversations often focus on device access—yet the deeper divide lies in experiential access. According to the 2022 National Center for Education Statistics (NCES) High School Transcript Study, 64% of students in high-poverty schools (≥75% free/reduced lunch) had zero opportunities to use oscilloscopes, gas chromatographs, or micro-pipettes during their K–12 science education. Conversely, 92% used Kahoot!, Nearpod, or DreamBox at least weekly. This isn’t just about equipment cost: a full Arduino Starter Kit costs $39.99 (Elegoo), and a basic optics bench with lenses and lasers runs $129 (Thorlabs EDU-KIT1)—less than half the annual per-student licensing fee for many LMS-integrated science platforms. More critically, low-income schools report 3.7× higher rates of ‘experiment substitution’—replacing labs with videos—due to safety concerns, storage limitations, or perceived time constraints.
Teacher Capacity and Curriculum Design
Effective integration requires pedagogical redesign—not just tool replacement. A RAND Corporation study of 227 science teachers found that those who blended screens and experiments using backward design (starting from performance expectations in NGSS) saw the strongest gains. For example, teachers in the Chicago Public Schools’ STEM Equity Initiative began units with a provocative physical phenomenon (e.g., why a raw egg survives a 2-meter drop onto foam but not concrete), then used PhET simulations to model force distribution, followed by student-designed impact-absorption prototypes. This sequence increased engineering design proficiency scores by 41% over control groups using simulations alone.
Evidence from International Benchmarks
PISA 2022 science literacy data reveals stark contrasts. Students in Singapore—who average 1.2 hours/week of structured lab work alongside targeted digital review—scored 551 (vs. OECD average 485). By contrast, students in Portugal, where 68% of science instruction occurs via interactive whiteboards and pre-recorded demos, scored 472. Notably, Singapore’s national curriculum mandates minimum lab time: 30% of secondary science instructional hours must involve apparatus manipulation. Finland, another top performer (523), restricts screen use to <15 minutes per 50-minute lesson for grades 1–6, prioritizing outdoor fieldwork and material exploration.
Long-Term Attitudinal Effects
Attitudes toward science predict persistence far more strongly than test scores. The 2023 GEMS (Girls in Engineering, Math, and Science) longitudinal cohort tracked 3,142 students from grade 5 through college enrollment. Those who completed ≥25 hands-on investigations before age 14 were 2.8× more likely to declare a STEM major—and 3.4× more likely to persist past sophomore year—than peers with equivalent screen-based exposure. Interviews revealed consistent themes: ‘I knew I could fix it when the circuit didn’t work,’ and ‘Seeing mold grow on my petri dish made microbiology real.’ These moments of agency and consequence rarely emerge from algorithm-driven adaptive platforms.
Practical Integration Strategies
Eliminating screens is neither feasible nor advisable. Instead, educators should adopt tiered integration based on cognitive demand:
- Conceptual visualization: Use simulations for inaccessible scales (e.g., atomic bonding in MolView, stellar evolution in Stellarium).
- Procedural rehearsal: Employ short, ungraded VR walkthroughs (e.g., Labster’s pipetting module) before live practice—reducing initial errors by 44% (University of Michigan, 2022).
- Authentic investigation: Reserve physical materials for hypothesis generation, iterative testing, and error analysis—where unpredictability drives deeper learning.
- Data interpretation: Combine real sensor outputs (e.g., Vernier LabQuest data on CO2 absorption) with spreadsheet modeling to bridge empirical and computational thinking.
Crucially, avoid ‘simulation substitution’—using digital tools to replicate physical labs without added value. If students can achieve the same learning outcome faster and more reliably with hardware, choose hardware.
Budget-Conscious Experiment Scaling
Schools with limited resources can still prioritize tactile learning. The ‘$100 Lab Challenge’—adopted by 117 districts in 2023—requires teachers to design a full unit using ≤$100 in consumables. Successful examples include:
- Wind turbine efficiency: PVC pipe, DC motors ($8.99, RadioShack), anemometers ($24.95, AcuRite), and recycled fan blades.
- Enzyme kinetics: Fresh pineapple juice (bromelain source), gelatin, and digital thermometers ($12.50, Etekcity).
- Water quality analysis: Test strips (API Freshwater Master Kit, $29.99), turbidity tubes ($14.50, LaMotte), and local stream samples.
These kits yield authentic datasets comparable to professional environmental monitoring—while costing less than one month of subscription fees for most cloud-based science platforms.
Measuring What Actually Matters
Assessments must align with the intended learning. Multiple-choice quizzes on simulated lab steps measure recall—not experimental reasoning. Better metrics include:
- Pre-/post-lab prediction accuracy (e.g., ‘Will adding salt increase or decrease boiling point? Why?’)
- Number of self-initiated iterations during open-ended challenges (e.g., redesigning a parachute for slow descent)
- Quality of error analysis narratives (coded using rubrics like the Experimental Practices Framework)
- Retention of core principles after 8-week delay (measured via concept mapping)
A 2024 pilot in Broward County Public Schools replaced 30% of digital quiz points with ‘lab reflection portfolios.’ Students submitted annotated photos, raw data tables, and written responses to prompts like ‘What surprised you? What would you change next time?’ This shift correlated with a 22% increase in NGSS-aligned performance task scores and a 17% reduction in science anxiety, as measured by the Science Anxiety Scale (SAS-12).
Policy and Infrastructure Considerations
State science standards increasingly emphasize ‘doing’ over ‘knowing.’ The Next Generation Science Standards explicitly require students to ‘plan and conduct investigations’ (SEP3) and ‘analyze and interpret data’ (SEP4)—practices fundamentally rooted in material interaction. Yet only 29 states include lab requirements in graduation criteria. California mandates 20 hours of documented lab work for biology credit; Texas requires no minimum. This regulatory gap perpetuates inequity: a 2023 Education Trust analysis found that schools in the bottom quartile of funding provided 4.2 hours/year of hands-on science versus 18.7 hours in top-quartile schools.
| Tool Type | Average Cost per Student (Annual) | Conceptual Gain (SD) | Experimental Reasoning Gain (SD) | 6-Week Retention Rate | Teacher Implementation Fidelity (Avg.) |
|---|---|---|---|---|---|
| PhET Simulations (CU Boulder) | $0.00 (open access) | 0.31 | 0.19 | 58% | 87% |
| Labster VR Labs | $22.50 (per student license) | 0.28 | 0.12 | 51% | 63% |
| Traditional Hands-On Labs | $14.20 (materials + maintenance) | 0.44 | 0.63 | 79% | 76% |
| Blended (Hands-on + Targeted Simulation) | $18.60 | 0.52 | 0.81 | 86% | 71% |
Data synthesized from NSF DRK–12 grants (2019–2023), Journal of Science Teacher Education (2022), and internal reports from LabXchange, PhET, and Labster. Costs reflect 2023 U.S. district averages for grades 6–12; gains reported as Hedges’ g effect sizes from meta-analyses.
Finally, consider infrastructure beyond budgets. Ventilation for chemistry labs, dedicated storage for robotics kits, and electrical outlets rated for sustained 20-amp loads are prerequisites for meaningful experimentation—yet 41% of U.S. schools report outdated wiring as a barrier to modern physics labs (National Science Teachers Association, 2023). Investing in these foundations yields longer-term returns than recurring SaaS subscriptions.
One teacher in rural Maine summarized it plainly after piloting both approaches: ‘When they break a thermometer, they learn about precision. When the simulation crashes, they learn to click “refresh.”’ That distinction—between fragility as pedagogy and friction as failure—lies at the heart of what makes science education transformative. Screens deliver information efficiently. Experiments deliver understanding durably. The most effective STEM classrooms don’t choose one over the other—they deploy each where its unique affordances best serve the learner’s developmental needs and the discipline’s epistemic norms.
The evidence is unequivocal: tactile, material engagement with phenomena remains the irreplaceable core of scientific literacy. Digital tools, when thoughtfully integrated, extend that core—they do not replace it. As new generative AI tutors and immersive environments enter classrooms, the imperative grows sharper: preserve the space where students touch, break, measure, smell, adjust, and wonder—not because it’s nostalgic, but because it’s neurologically and epistemologically necessary.
For curriculum designers, this means writing labs first—and then asking, ‘What digital support makes this richer, safer, or more accessible?’ For administrators, it means evaluating edtech ROI not by login counts, but by increases in student-led question generation and apparatus troubleshooting. And for policymakers, it means codifying lab time as non-negotiable infrastructure—as essential as textbooks or broadband access.
Science is not a body of facts to be streamed. It is a practice to be performed. Every solder joint, every titration endpoint, every failed rocket launch followed by redesign—that is where scientific identity takes root. Screens inform. Experiments initiate.
More Articles
 Robot Making for Kids: 7 Screen-Free STEM Projects
 Engineering Challenges for Families
 Simple Coding Games for Elementary Kids
 10 Fun Science Fair Projects for Kids
 How to Build a Boom! STEM Activities for Kids
 Screen-Free Math Games for Kids Ages 5-10
 Plant-Based Milk Showdown: Truth vs. Young Analysis
 What Is Market Research for Kids? (2026)
 Best Robotics Kits for Beginners in 2026
 STEM Learning Platforms for K-12 Educators