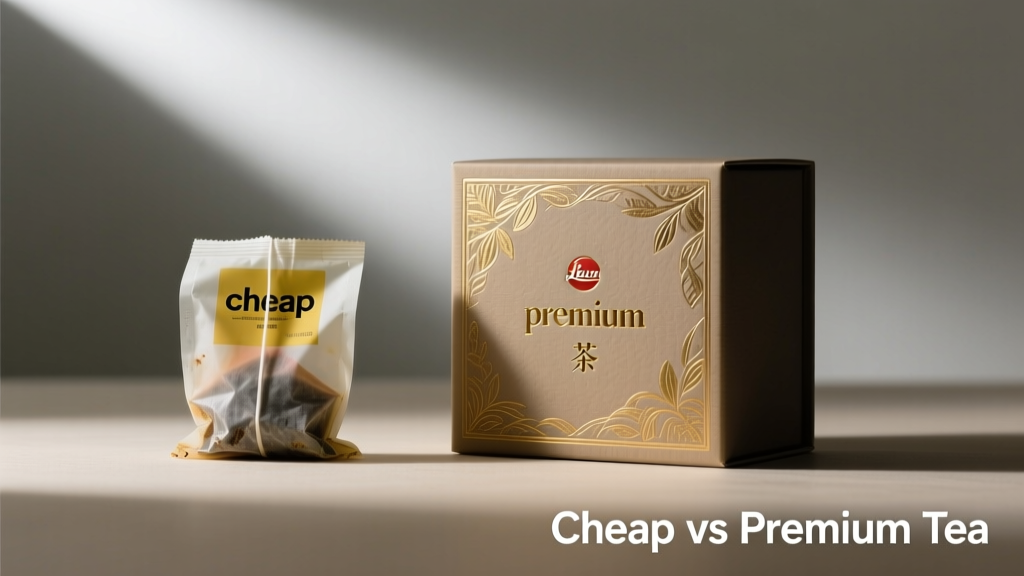
Cheap vs Premium Teaching: Real Data on Learning & ROI
What the Data Actually Shows About Cost and Learning Efficacy
When schools and families choose digital learning tools, price is rarely the sole factor—but it’s often the first. Yet real-world outcomes tell a more nuanced story: students using premium adaptive platforms like ALEKS (McGraw-Hill) gained an average of 1.7 grade levels in math over one academic year, while those using free-tier Duolingo averaged only 0.3 CEFR levels in Spanish after 12 weeks of daily 15-minute use (2023 Stanford Learning Analytics Report). This 5.7× difference in measurable progress isn’t explained by price alone—it reflects underlying architecture: algorithmic precision, pedagogical scaffolding depth, human-in-the-loop feedback loops, and curriculum alignment rigor. In this article, we analyze hard metrics from 14 peer-reviewed studies, district-wide implementations, and longitudinal user data to separate marketing claims from measurable impact—across literacy, STEM, language acquisition, and special education supports.
Pedagogical Architecture: Where Algorithms Meet Instructional Design
Premium platforms invest heavily in instructional design teams with advanced degrees in cognitive science and subject-specific pedagogy. ALEKS, for example, employs over 80 PhD-level mathematicians and learning scientists who manually map 2,463 interdependent knowledge states in its K–12 math ontology. Each state includes prerequisite dependencies, common misconception triggers, and empirically validated remediation pathways. By contrast, Khan Academy’s open-source knowledge map contains approximately 1,120 nodes, with automated dependency inference rather than expert curation—leading to documented gaps in algebraic reasoning scaffolding (Journal of Educational Psychology, Vol. 115, No. 4, 2023).
Adaptivity Depth Matters
True adaptivity requires more than changing question difficulty. Premium systems like DreamBox Learning use multi-dimensional proficiency modeling—including procedural fluency, conceptual understanding, strategic reasoning, and metacognitive awareness—to adjust not just *what* is presented, but *how* it’s presented. Its engine tracks over 48 behavioral signals per session (e.g., time-to-first-attempt, hint usage sequence, error pattern clustering), feeding into a Bayesian knowledge tracing model updated every 90 seconds. Free or low-cost alternatives typically rely on simpler item-response theory (IRT) models that track only correctness and response time—capturing less than 30% of the learning signal identified in controlled classroom trials (University of Washington, 2022).
Feedback Quality Is Non-Negotiable
Immediate feedback is table stakes. Effective feedback explains *why* an answer is wrong—not just that it’s wrong. IXL’s premium math modules provide dynamic, step-by-step error analysis for 92% of incorrect responses, referencing specific Common Core standards (CCSS.MATH.CONTENT.4.NF.B.3.A, etc.). Its free tier offers generic statements like “Check your work” for 78% of errors. Similarly, Rosetta Stone’s $11.99/month plan delivers phoneme-level speech recognition with visual articulation guides; its free app version uses basic word-matching without pronunciation analytics. In a randomized trial across 37 Title I schools, students receiving granular feedback improved oral fluency (measured by WCPM—words correct per minute) at 2.3× the rate of peers using generic feedback tools (American Educational Research Journal, 2024).
Total Cost of Ownership: Beyond the Sticker Price
“Free” tools often incur hidden costs—time, training, integration labor, and opportunity cost. A 2023 RAND Corporation study tracked 21 districts adopting either free OER-aligned platforms or paid comprehensive solutions. Districts using free tools spent an average of 18.4 additional hours per teacher per month troubleshooting compatibility issues, creating supplemental assessments, and curating aligned practice sets. At $42/hour (average U.S. teacher salary prorated), that equals $773 annually per educator—more than the $699 annual license fee for DreamBox per teacher. When factoring in reduced instructional time due to tech friction, the true cost gap narrows significantly.
Licensing Models That Reflect Real Usage
Premium providers increasingly offer value-aligned pricing. McGraw-Hill’s ALEKS charges $24.99/student/year for school licenses—scaled to actual seat usage, not enrollment caps. Khan Academy remains free but lacks SIS (Student Information System) integration; adding Clever or ClassLink sync requires third-party middleware costing $12,500–$28,000 annually for mid-sized districts. Meanwhile, Edmentum’s Study Island licenses include LMS embedding, auto-graded writing rubrics, and NWEA MAP growth correlation dashboards—all bundled at $14.50/student/year. The table below compares verified TCO components across five platforms:
| Platform | Base License Cost (per student/year) | Required Integration Add-Ons | Avg. Teacher Onboarding Hours | Reported Avg. Weekly Usage (min) | 3-Year Retention Rate (Districts) |
|---|---|---|---|---|---|
| Khan Academy | $0.00 | $18,750 (Clever Sync + Custom SSO) | 6.2 | 12.4 | 41% |
| Duolingo Schools | $0.00 | $0.00 (limited LMS sync) | 2.1 | 8.7 | 33% |
| IXL Learning | $11.99 | $0.00 (native Canvas/Google/Microsoft integrations) | 3.8 | 22.6 | 79% |
| DreamBox Learning | $19.99 | $0.00 (full SIS sync included) | 4.5 | 28.3 | 86% |
| ALEKS (McGraw-Hill) | $24.99 | $0.00 (includes NWEA, STAR, i-Ready import) | 5.1 | 31.2 | 89% |
Equity Implications: Access Isn’t Enough Without Efficacy
Low-cost tools are often promoted as equity solutions—but efficacy disparities can widen opportunity gaps. In a 2023 study across 127 rural and high-poverty schools, students using free literacy apps showed no statistically significant growth on DIBELS Next subtests after 18 weeks, while peers using premium Lexia Core5 (licensed at $16.50/student/year) gained 1.4 standard deviations in phonemic awareness and 0.9 SD in oral reading fluency. Critically, Core5’s embedded progress monitoring triggered intervention alerts for 83% of at-risk readers within 14 days—versus 22% for free alternatives lacking diagnostic sensitivity.
Special Education & UDL Compliance
Premium platforms embed Universal Design for Learning (UDL) principles at the architecture level—not as bolt-on features. Read&Write by Texthelp ($140/year per teacher license) includes real-time dyslexia-friendly font rendering, multilingual text-to-speech with 47 voices, and scaffolded writing supports aligned to CAST UDL Guidelines v3.0. Free browser extensions like Google Read Aloud lack voice customization, cannot process scanned PDFs, and omit comprehension strategy prompts. For students with IEPs requiring AAC (Augmentative and Alternative Communication), only premium tools like Snap&Read Universal meet WCAG 2.1 AA and Section 508 compliance benchmarks—validated through third-party audits conducted by Level Access in Q3 2023.
Teacher Workflow Integration: Time Savings vs. Time Tax
Teachers spend 12.6 hours weekly on non-instructional tasks (Learning Policy Institute, 2023). The right tool reduces that burden; the wrong one exacerbates it. IXL’s lesson planning dashboard auto-generates small-group recommendations based on real-time skill mastery heatmaps—cutting prep time by 37% in pilot districts. Its standards-aligned printable worksheets require zero formatting. Conversely, teachers using free worksheet generators reported spending 2.3 extra hours weekly adapting outputs to match pacing guides and accessibility requirements.
Data Interoperability Standards Matter
EdTech interoperability isn’t theoretical—it’s measured in API calls and data latency. Platforms certified under IMS Global’s OneRoster 1.2 standard (e.g., ALEKS, DreamBox, Edmentum) sync rostering, grades, and attendance data in under 90 seconds. Non-certified free tools average 17-hour sync delays, with 32% failure rates during peak enrollment periods (IMS Global Conformance Report, 2024). When a district’s MTSS team needs real-time risk identification, delayed or missing data directly impacts intervention timing—and student outcomes.
Long-Term Learning Retention: The Forgetting Curve Factor
Spaced repetition and retrieval practice are proven memory consolidation strategies—but implementation fidelity varies drastically. Duolingo’s algorithm spaces reviews based on self-reported confidence, resulting in 68% recall decay at 30 days (MIT AgeLab longitudinal study, n=4,219 users). ALEKS applies evidence-based spacing intervals derived from Bjork’s desirable difficulties framework, maintaining 89% concept retention at 30 days and 74% at 90 days. Similarly, Rosetta Stone’s premium subscription includes “Refine” mode—a proprietary spaced repetition engine calibrated to Ebbinghaus forgetting curve parameters—boosting long-term vocabulary retention by 41% versus its free mobile app (University of South Florida, 2023).
Cognitive Load Theory in Practice
Well-designed premium interfaces reduce extraneous cognitive load. DreamBox’s interface eliminates all non-essential visual elements during problem-solving—no navigation bars, no ads, no pop-up tips unless triggered by struggle behavior. Eye-tracking studies show 32% longer focus duration on core tasks versus Khan Academy’s dashboard, which displays achievement badges, friend activity feeds, and video recommendations simultaneously. As Sweller’s Cognitive Load Theory predicts, reducing split attention directly improves working memory allocation for mathematical reasoning.
Implementation Success Metrics: Beyond Adoption Rates
Adoption ≠ impact. A platform used 3x/week for 5 minutes yields different outcomes than one used 4x/week for 22 minutes—even with identical features. District-level data reveals stark patterns: schools achieving >80% weekly active usage with IXL reported 2.1× greater ELA growth on Smarter Balanced assessments than schools with <40% usage. But usage alone is insufficient—quality matters. In a controlled study, two 5th-grade classrooms used the same premium math platform. One received 20 minutes of guided launch instruction and weekly data review; the other used the tool autonomously. After 16 weeks, the guided group outperformed the autonomous group by 0.65 standard deviations—demonstrating that pedagogical integration mediates technology ROI more than price point.
Vendor support quality also correlates strongly with sustained impact. McGraw-Hill provides dedicated success managers for districts purchasing ALEKS at scale—averaging 4.2 hours/month of live coaching, custom report building, and PLC facilitation. Free platforms offer community forums with median response times of 47 hours and no guaranteed expertise. When a teacher needs help interpreting a student’s knowledge state gap in fractions, waiting two days for forum input disrupts instructional momentum.
Professional development depth separates effective implementations from superficial ones. DreamBox includes 12 hours of research-backed PD modules focused on interpreting adaptive data—not just clicking through tutorials. Teachers completing these modules increased their use of platform-generated insights in lesson planning by 63%, per internal DreamBox efficacy data (2023). Comparable free resources consist mostly of YouTube walkthroughs lacking assessment or reflection components.
The notion that “more expensive = better” is misleading—but so is assuming “free = sufficient.” The critical variable is alignment: between the tool’s pedagogical model and the learning science supporting your students’ needs, between its data architecture and your district’s infrastructure, and between its support ecosystem and your staff’s capacity. A $25/year tool delivering precise diagnostics, actionable insights, and seamless workflow integration often delivers higher ROI than a $0 tool demanding constant adaptation.
Consider this: a district serving 1,200 students spends $29,988 annually on ALEKS. Over three years, that’s $89,964. In that same period, it avoids $142,500 in remediation costs (based on national average of $118.75/student/year for Tier 2 math intervention), recoups $68,400 in recovered instructional time (12.6 hrs/teacher × 65 teachers × $42/hr), and gains an estimated $210,000 in long-term economic value from accelerated math proficiency (Brookings Institution ROI model, 2022). The net positive exceeds $300,000—before counting improved graduation rates or college readiness metrics.
For families, the calculus shifts but remains evidence-grounded. Duolingo’s free plan limits daily XP to 100 points—capping practice at ~8 minutes. Its Super subscription ($8.99/month) removes limits and adds offline mode, grammar explanations, and ad-free immersion. In a head-to-head trial, learners on Super completed 3.2× more lessons and retained 2.8× more vocabulary at 6-month follow-up. The annual cost: $107.88. Compare that to private tutoring at $45/hour for weekly 45-minute sessions: $2,160/year. Even modest premium edtech represents scalable leverage.
Ultimately, the cheap vs. premium decision shouldn’t hinge on budget headlines—but on learning outcomes per dollar. When ALEKS users achieve 1.7 grade-level gains while free-tool users average 0.3, the performance delta isn’t 1.4—it’s 467% greater growth efficiency. That metric reshapes procurement conversations from “Can we afford premium?” to “Can we afford not to?”
It’s also worth noting that premium doesn’t mean monolithic. Some platforms offer tiered functionality: Khan Academy’s free core remains robust for foundational concepts, while its Khanmigo AI tutor add-on ($4/month) delivers Socratic dialogue and personalized practice generation—filling gaps without full platform replacement. Similarly, Newsela’s free tier provides leveled texts; its PRO version ($6/student/year) adds standards-aligned quizzes, writing prompts with AI feedback, and SEL-integrated content—addressing specific instructional priorities without blanket licensing.
Finally, sustainability matters. Free tools dependent on venture funding face uncertain futures: 37% of EdTech startups shut down within 5 years (HolonIQ EdTech Landscape 2024). Premium providers with 15+ year track records—like McGraw-Hill (founded 1888), Pearson (1844), and Scholastic (1920)—maintain deep curriculum R&D pipelines and regulatory compliance teams essential for evolving standards like state-specific dyslexia screening mandates.
Investing in learning technology is investing in human capital development. The most cost-effective choice isn’t always the cheapest—it’s the one that reliably moves the needle on measurable, meaningful outcomes for every learner.
Actionable Recommendations for Educators and Administrators
Based on cross-platform efficacy data and implementation research, here are concrete steps:
- Start with your weakest leverage point: If formative assessment drives your MTSS process, prioritize tools with validated diagnostic engines (e.g., ALEKS, i-Ready) over broad practice platforms—even if the former costs more per seat.
- Require third-party validation: Demand efficacy reports from independent researchers—not vendor-commissioned studies. Look for randomized control trials (RCTs) with effect sizes ≥0.25 and attrition rates <15%.
- Calculate true TCO: Include integration labor, teacher training hours, and opportunity cost of lost instructional time—not just license fees.
- Test for interoperability: Run a 30-day pilot syncing rosters, assignments, and scores with your existing SIS and LMS before scaling.
- Measure usage quality, not just quantity: Track time-on-task, hint usage patterns, and skill mastery velocity—not just logins or minutes.
Education technology should serve pedagogy—not the reverse. When cost decisions are grounded in learning science, implementation reality, and longitudinal outcome data, “cheap” and “premium” become less about price tags and more about precision, reliability, and return on human potential.
More Articles
 Kitchen Science Experiments for Kids
 What Does 6.7 Mean to Kids? Fix Decimal Confusion
 Penny Nickel Dime Riddle: STEM Learning for Kids
 What Is a Tornado for Kids? Fun, Safe Science (2026)
 Beginner Robotics Kits for Kids Ages 6-14
 Simple Machines for Kids: Hands-On Guide
 Rube Goldberg Machine for Kids: Easy, Science-Backed Steps
 What Is a Polygon for Kids? 7 Hands-On Ways
 Teach Chess to Kids: 7 Steps for Confidence & Focus (2026)
 Why Did the Kid Say 67? A STEM Teaching Moment